Lightning is an important source of upper troposphere nitrogen oxides; however, there is high uncertainty in the amount of nitrogen oxides produced from lightning. Our work decreases this uncertainty using a combination of improved resolution imagery and upper tropospheric nitrogen oxides chemistry.
Cited/referenced papers on project page:
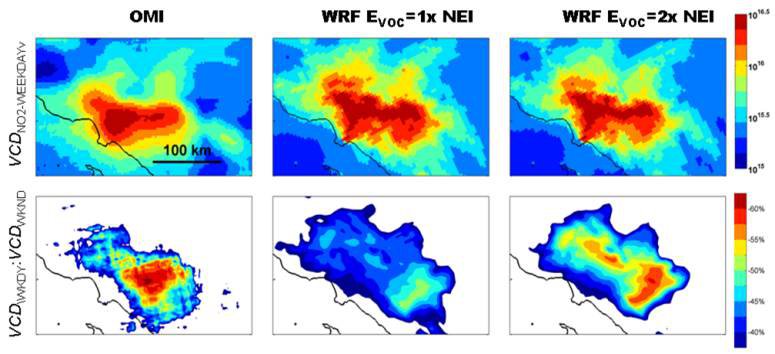
- Laughner and Cohen: Quantification of the effect of modeled lightning NOx on UV–visible air mass factors, Atmos. Meas. Tech. 10, 4403-4419, 2017.
- Nault et al. : Lightning NO x Emissions: Reconciling Measured and Modeled Estimates With Updated NO x Chemistry, Geophys. Res. Lett. 44, 9479-9488, 2017.